Three.jsのラインをパーリンノイズで波っぽく作ってみる
- 2021.12.17
- 01_技術ブログ Three.js
- #Javascript
こんにちは!
プログラム学習中のdynaです。
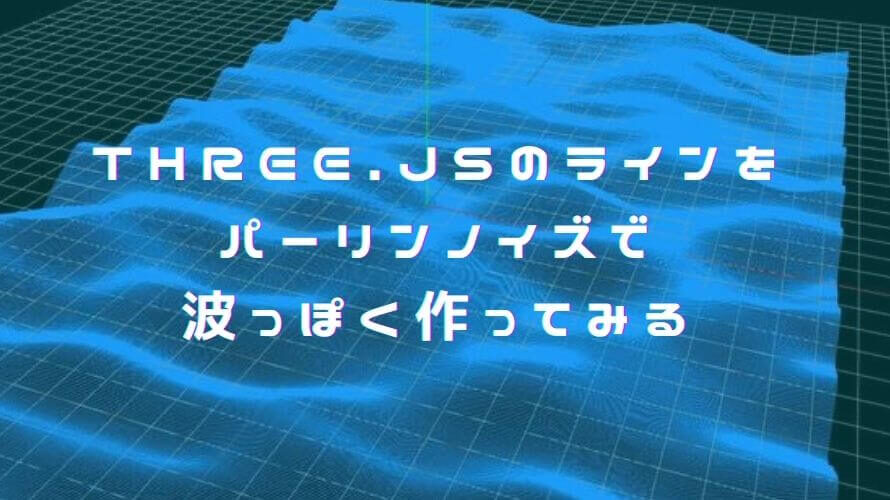
今回は「Three.js」とパーリングノイズの「perlin.js」を使って、lineを波っぽく動かしてみました。
デモ↓
参考にさせていただいたのはこちらのサイトです。
https://www.pentacreation.com/blog/2020/10/201009.html
大変参考になります。ありがとうございます。
今までの記事はthree.jsのカテゴリーにまとまっていますので、ご参考までに。
考え方
線をたくさん描画して、それをランダムに動かしただけです。
近くで見たら波には見えませんが、動きのはこんな感じなのか~と思っていただければ。
ではコードを見ていきます。
three.jsで線を作る
まずはthree.jsで線を書きます。
試しに1本書いてみます。
1 2 3 4 5 6 7 8 9 10 11 12 13 14 15 16 17 18 19 20 21 22 23 24 25 26 27 28 29 30 31 32 33 34 35 36 37 38 39 40 41 42 43 44 45 46 47 48 49 50 51 52 53 54 55 56 57 58 59 60 61 62 63 64 65 66 67 68 69 70 | <body> <div id="WebGL-output"></div> <script type="module"> import * as THREE from'https://unpkg.com/three@0.126.1/build/three.module.js'; import { OrbitControls } from 'https://unpkg.com/three@0.126.1/examples/jsm/controls/OrbitControls.js'; let camera; let scene; let renderer; let dirLight; let gridHelper; let axisHelper; init(); animate(); function init() { //シーンの作成 scene = new THREE.Scene(); //カメラの作成 camera = new THREE.PerspectiveCamera(45, window.innerWidth / window.innerHeight, 0.1, 1000); //カメラセット camera.position.set(20, 30, 50); camera.lookAt(new THREE.Vector3(0, 0, 0)); //光源 dirLight = new THREE.SpotLight(0xffffff,1.5);//color,強度 dirLight.position.set(-30, 40, 30); scene.add(dirLight); //レンダラー renderer = new THREE.WebGLRenderer({ alpha: true, antialias: true }); renderer.setClearColor(new THREE.Color(0x000000)); renderer.setSize(window.innerWidth, window.innerHeight); // 滑らかにカメラコントローラーを制御する const controls = new OrbitControls(camera, document.body); controls.enableDamping = true; controls.dampingFactor = 0.2; // gridHelper gridHelper = new THREE.GridHelper(80, 50,0xffff00) //大きさ・分割数・センタラインcolor・マスカラ― scene.add(gridHelper); // axisHelper axisHelper = new THREE.AxisHelper(50); // 軸のサイズ scene.add(axisHelper); //頂点座標の配列(line) const points = []; points.push(new THREE.Vector3(-10,3,0)); points.push(new THREE.Vector3(10,10,0)); //頂点座標の配列からBufferGeometryを生成 const geometry = new THREE.BufferGeometry().setFromPoints(points); const material = new THREE.LineBasicMaterial(); const line = new THREE.Line(geometry,material); scene.add(line); ...続く |
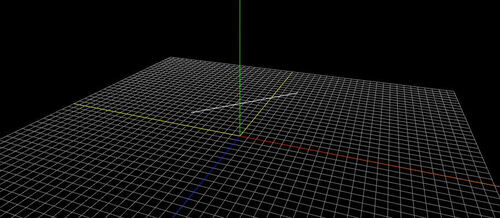
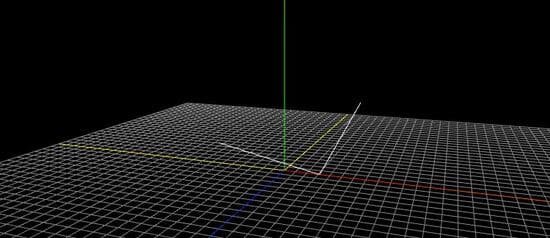
これで表示をすると、こんな感じになります。
白い線が1本書かれているのが分かります。
1本線の作り方
ちょっとややこしいので、簡単に記録を。
基本的には、公式のこちらを見るとよくわかります。
https://threejs.org/docs/#api/en/objects/Line
このブログで書いたコード内で線を作っている部分は、以下の部分です。
1 2 3 4 5 6 7 8 9 10 11 12 | //頂点座標の配列(line) const points = []; points.push(new THREE.Vector3(-10,3,0));//開始位置 points.push(new THREE.Vector3(10,10,0));//終点位置 //頂点座標の配列からBufferGeometryを生成 const geometry = new THREE.BufferGeometry().setFromPoints(points); const material = new THREE.LineBasicMaterial(); const line = new THREE.Line(geometry,material); scene.add(line); |
まずは必要なものの説明を。
THREE.Vector3
3Dベクトルを表すクラス。3Dベクトルは、順序付けられた数値のトリプレット(x、y、zのラベルが付いています)であり、次のようなさまざまなものを表すために使用できます。
・3D空間内のポイント。
・3D空間での方向と長さ。three.jsでは、長さは常に (0、0、0)から(x、y、z)までの ユークリッド距離(直線距離)になり、方向も(0、0、0)から( x、y、z)
・任意の順序の数字のトリプレット。
引用元:https://threejs.org/docs/#api/en/math/Vector3
BufferGeometry
メッシュ、ライン、またはポイントジオメトリの表現。バッファ内に頂点位置、面インデックス、法線、色、UV、およびカスタム属性が含まれ、このすべてのデータをGPUに渡すコストを削減します。
引用元:https://threejs.org/docs/#api/en/core/BufferGeometry
THREE.Line
実線。
引用元:https://threejs.org/docs/#api/en/objects/Line
THREE.Vector3を使って頂点座標を配列で作成し、その頂点座標を使ってBufferGeometry
で表現します。それをもとに、THREE.Lineを使って実線で表示します。
THREE.LINEに紹介されているコードそのまま使っている形です。
ちなみに、vector3に頂点を追加すると、こんな感じにいろいろ変更できます。
1 2 3 4 5 | points.push(new THREE.Vector3(-10,3,0)); points.push(new THREE.Vector3(5,0,0)); points.push(new THREE.Vector3(10,10,0)); |
線をたくさん作る
この頂点を使って、たくさんの線を書いてみます。
先ほどの頂点座標の部分を以下に書き換えます。
試しに800本にしてみます。
1 2 3 4 5 6 7 8 9 10 11 12 13 14 15 16 17 18 19 20 21 22 23 24 25 26 27 28 29 30 31 32 33 34 35 36 | -- axisHelperから以下-- //LINEを配列に格納 let lineArr = []; //本数 const lineNum = 800; //長さ const lineLength = 50; //セグメント数 const segmentNum = 50; //ふり幅 const amplitude = 3; for(let i = 0; i < lineNum; i++){ //頂点の作成 const points = []; for(let j = 0; j <= segmentNum; j++){ const x = j - (segmentNum / 2 ) ; const y = 0.3 * j; const z = i * 0.1 - ((lineNum * 0.1) / 2);; const p = new THREE.Vector3(x,y,z); points.push(p); } const geometry = new THREE.BufferGeometry().setFromPoints(points); const material = new THREE.LineBasicMaterial(); const line = new THREE.Line(geometry,material); lineArr[i] = line; scene.add(lineArr[i]); } --つづく-- |
ここでは、forで800本のラインの頂点(x,y,z)を少しづつずらして追加しています。
そのあとラインを描画していきます。
※x、y、zで中心に表示するようにしたりしてるので、少し計算が混じっています。
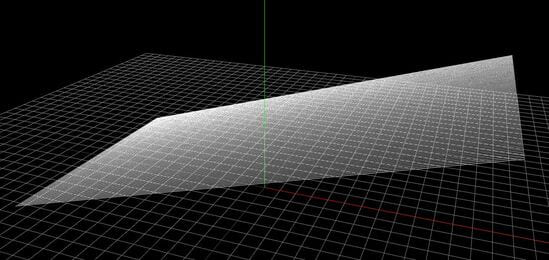
ここまでで数値を色々動かしてこんな感じになりました。
その線をランダムに動かす
ここまで来たら、この線をランダムに動かしていきたいと思います。
ランダムに動かすには、パーリンノイズを使っていきます。
パーリンノイズは自然な乱数だそうです。
perlin.js を使ってパーリンノイズを作る
参考サイトをもとに、perlin.jsを読み込みます。
https://github.com/joeiddon/perlin
良く思うのですが、ほんと作った人はすごいなと思います・・・。
読み込めたら設定してみます。
以下は抜粋のコードです。
先ほどの線をたくさん作った部分の変数を引き継いでいます。
この部分は以下のサイトも参考にしています。
https://ics.media/entry/18812/
1 2 3 4 5 6 7 8 9 10 11 12 13 14 15 16 17 18 19 20 21 22 23 24 25 26 27 | for(let i = 0; i < lineNum; i++){ const line = lineArr[i]; const positions = line.geometry.attributes.position.array; //動く時間 const time = Date.now() / 2000; //ノイズの変化 j for(let j = 0; j <= segmentNum; j++){ const x = j - lineLength / 2; const px = j * 0.1 + time; const py = i / 50 + time; const y = amplitude * noise.perlin2(px,py);//ふり幅*自然な乱数 const z = i * 0.1 - ((lineNum * 0.1) / 2); positions[j * 3] = x; positions[j * 3 + 1] = y; positions[j * 3 + 2 ] = z; } const color = new THREE.Color(0x2188f9); line.material.color = color; line.geometry.attributes.position.needsUpdate = true; } |
アニメーションさせる
先ほどのコードをアニメーションさせる関数の中に入れておきます。
その後、HTMLにレンダリングを追加描画して完成です。
今までの記事はこちらにありますので、基本的な構成などについては以下に記載しています↓
パーリンノイズが面白かったので、色々試してみたいと思います。
ここまで読んで下さりありがとうございます。


![Three.js [axisHelper、gridHelper ]ヘルパーを使い、グリッド平面を表示する。](https://notetoself-dy.com/wp-content/uploads/2021/12/grid-200x160.jpg)


